🚨 Heat islands: the public tool that finally tells us WHERE to act as a priority
🔍🌡️ Mapping of LCZ: a public and free tool to identify, sector by sector, where heat accumulates in the city — and prioritise cooling where populations are most vulnerable. 💡 An entry diagnosis to be cross-referenced with health, precariousness, and biodiversity.
📌 Urban heat kills and makes people ill, but we do not always know where to act first with limited resources. This report explains how to identify, for free and neighbourhood by neighbourhood, the areas that trap the most heat — and then how to cross-reference this information with vulnerable populations, sensitive establishments, or precariousness. Specifically, it provides a shared diagnostic basis to target priority areas, argue with elected officials, and inform urban planning documents. An entry tool, accessible without heavy technical skills.
Source :📒 Mapping of LCZ — A tool for cooler cities✍️ Cerema (Editions of Cerema), with the support of the Ministry of Ecological Transition — July 2026📜🔗LINK to the source
1️⃣ ANALYTICAL SUMMARY
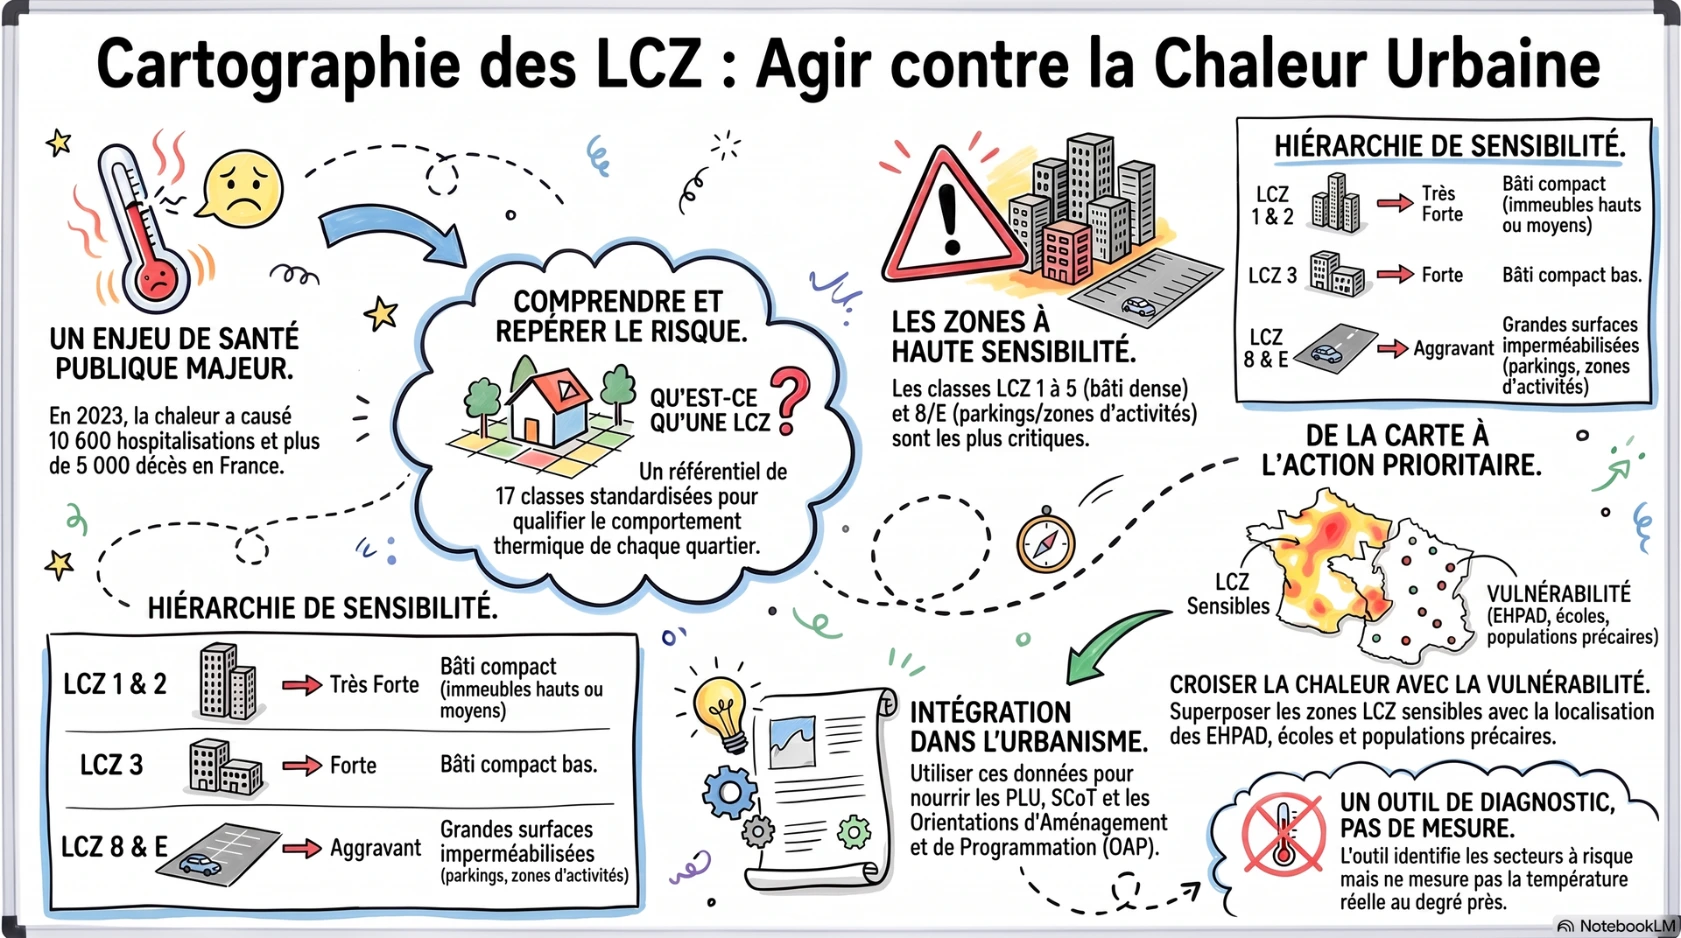
From experienced overheating to mapped overheating. The increasing frequency of heatwaves makes the urban heat island (UHI) a major health and living environment risk, particularly in dense and mineralised areas (p.4-7). The document recalls significant orders of magnitude: during the summer of 2023, Public Health France attributed approximately 20,000 emergency care visits, 10,600 hospitalisations, and over 5,000 deaths to heat (p.4); by the end of the century, 40 tropical nights per year would become the norm, compared to 6 at the end of the 20th century (p.6-7). In the face of rare land opportunities, public decision-making needs reliable and homogeneous data to know where to intervene as a priority (p.5).
An entry tool, not an end in itself. The national mapping of LCZ, based on the work of Stewart and Oke (2012) and developed by Cerema using satellite imagery and open databases, classifies the territory into 17 typologies with homogeneous climatic behaviour (p.10-13). It identifies the most exposed classes (LCZ 1 to 5, 8 and E) and constitutes a "foundational brick" to be cross-referenced with other territorial data (p.8-9, 14-15). Freely accessible via the Cartagene platform and data.gouv.fr, it feeds into diagnostics, PLU, SCoT, PCAET, and OAP (p.19-27). The document systematically accompanies the tool with its limitations: it identifies sensitive areas but does not measure the intensity of the UHI, and is not suitable for small-scale developments (p.22-23).
2️⃣ KEY POINTS OF THE DOCUMENT
1️⃣ A standardised typology of 17 classes (10 built classes numbered 1 to 10, 7 unbuilt classes from A to G) allows for the qualification of each sector according to land use, vegetation, water, height, and the footprint of buildings (p.12-13). This international reference (Stewart and Oke, 2012) makes diagnostics comparable from one territory to another.
2️⃣ A hierarchy of sensitivity that can be directly exploited : LCZ classes 1 and 2 are of very high sensitivity, LCZ 3 is of high sensitivity, LCZ 4 and 5 are of moderate sensitivity, and LCZ 8 and E are aggravating factors (large impermeable surfaces of activity zones and car parks) (p.14-15). This grid immediately guides the identification of priorities.
3️⃣ A free tool with no registration required : the Cartagene platform (cartagene.cerema.fr) allows users to visualise the map, consult municipal statistics (distribution of LCZ, population by zone) and download data via data.gouv.fr to integrate into a GIS (p.19-21). The coverage concerns large urban areas, relies on the Urban Atlas Copernicus, and is regularly enriched with new areas (p.20-21).
4️⃣ Clearly defined limits, a mark of seriousness : the mapping does not measure ICU (actual temperature differences), is not suitable for fine analyses at the street or building scale, is less relevant for municipalities with fewer than 20,000 inhabitants and less than 20 km², and must be interpreted in light of climate change and the local context (p.18, 22-23). A recently greened square will not change the LCZ class of a sector (p.28).
5️⃣ A logic of systematic crossing : the value of the tool comes from its overlay with other data — vulnerable populations (under 5 years, over 65 years), precariousness, sensitive establishments (nursing homes, nurseries, schools), flood risk, green and blue networks, potential for de-impermeabilisation (p.9, 22-23, 38-42). Five concrete use cases (Lille, MACS/Capbreton, Rodez, Réunion/CINOR, Nîmes, Grand Reims) illustrate this approach from diagnosis to planning (p.24-35).
3️⃣ ACTION PATHS FOR LOCAL ACTORS
1️⃣ Establish a shared pre-diagnosis by consulting Cartagene to identify the sectors in LCZ 1 to 5, 8 and E of its territory, then follow the analysis "step by step" in three stages: identify, analyse the immediate environment, deepen according to local knowledge (p.22). Useful for objectifying an internal debate before any investment.
2️⃣ Cross the map with vulnerable populations by overlaying Insee data (ages, precariousness) and the survey of establishments receiving the public sensitive to extreme heat, to highlight "double priority" sectors — exposure + vulnerability (p.28-29, 38). Approach led by Rodez agglomeration as part of a PRSE.
3️⃣ Integrate the issue into urban planning documents : feed the diagnosis and the PADD of a PLU, include favourable measures in the regulations (share of green spaces, solar protections, building greening index), and target several sectors via a thematic OAP "cooling" (p.26). Support point for SCoT, PCAET, PLUi.
4️⃣ Mobilise the measure where the tool stops : on sensitive sites, position weather sensors or resort to modelling (Cerema / Météo France partnerships) to actually quantify the ICU, wind speeds and humidity (p.32-35). The mapping then serves to choose where to measure, not to measure.
5️⃣ Cross with other territorial policies to activate co-benefits: green and blue frameworks and potential for renaturation (biodiversity, p.39), de-sealing and runoff management (water, p.42), cooling pathways and calming of roadways (mobility, p.40), cold networks against the “thermal boilers” (building, p.41).
6️⃣ Interpret the uncovered areas from aerial photos when the territory is partially mapped (border municipality, unavailable data), to estimate whether an urban fabric exacerbates overheating or, conversely, contributes to cooling (p.22). Unmet need to anticipate : the tool does not assess the effect of a micro-development, which implies mobilising complementary tools (GeoClimate from CNRS, LCZ Generator, or metrology) for the project scale (p.44-45).
4️⃣ ADDITIONAL REFERENCES
1️⃣ Public Health France — Heat and health. Summer 2025 report (published on 26 February 2026). Quantifies recent health impacts (over 5,700 heat-related deaths during the summer, nearly three-quarters of which were among those aged 75 and over) and documents vulnerability — the health dimension that the LCZ notebook invokes without updating it.
2️⃣ Cerema — Renaturation operation: act deeply for living soils (2025). Operational publication (recommendations and examples) on the central lever "renature" of the notebook, with a focus on the quality and functionality of soils essential for evapotranspiration.
🔗 https://www.cerema.fr/fr/actualites/editions-operation-renaturation-agir-profondeur-sols-vivants
3️⃣ ADEME — Urban overheating diagnosis. Methods and feedback (June 2024). Lists nine diagnostic methods (including in situ measurements and modelling) and eleven feedbacks: a direct methodological complement to the explicit limit of the LCZ, which does not establish a quantitative diagnosis of the UHI.
5️⃣ FREQUENTLY ASKED QUESTIONS (FAQ)
1️⃣ Does the mapping of LCZ measure the actual temperature of my neighbourhood?
No. It identifies areas likely to contribute to the UHI based on their urban morphology, but does not quantify temperature differences. For that, weather sensors or modelling are needed (p.22-23, p.32).
2️⃣ How can I access it, and do I need an account?
Via the Cartagene platform (cartagene.cerema.fr), library section, without registration. The data is also available for free download on data.gouv.fr for GIS use (p.19-21).
3️⃣ Which classes should I prioritise?
The LCZ 1 to 5 (dense built-up, from most to least sensitive) as well as the LCZ 8 and E (large impermeable surfaces: activity zones, car parks, squares), identified as at risk (p.14-15, p.22).
4️⃣ Is the tool useful for a small municipality?
Less: the method is mainly suited to dense urban areas and loses relevance below 20,000 inhabitants and 20 km². For uncovered areas, aerial photo interpretation is recommended (p.18, p.22).
5️⃣ Can we use it to assess a specific project (a square, a street)?
No. The tool works at the neighbourhood scale; a micro-development does not change the LCZ class. Other tools are needed for the street or building scale (p.23, p.28, p.44).
6️⃣ Is it relevant in overseas territories and tropical climates?
Yes: the method has been adapted to local specificities, and the ICU also affects these territories, even those exposed to coastal breezes. The solutions must take into account natural ventilation and humidity (p.18, p.30-31).
7️⃣ Specifically, in which urban planning documents can I integrate it?
Diagnosis and PADD of a PLU, regulations (green spaces, solar protections, vegetation index), thematic OAPs, as well as SCoT, PCAET and PLUi (p.26).
6️⃣ REWRITING IN PLAIN LANGUAGE
What is the problem?
Cities are getting hotter.
Heat makes people ill. It can cause death in vulnerable individuals.
Areas with a lot of concrete and few trees heat up the most.
This is called a heat island.
What is this tool?
Cerema has created a free map.
This map shows the areas that heat up the most.
It classifies the city's zones into 17 types.
Each type behaves the same way in response to heat.
What can we do with it?
You are looking at the map of your city on the internet.
The site is called Cartagene. It is free.
You find the areas that are heating up the most.
Then, you choose where to act first.
What the map does not do
The map does not say the exact temperature.
It only shows the at-risk areas.
To know the real temperature, measuring devices are needed.
The map is not made for a small project, like a single garden.
Key takeaways
- Some areas heat up more than others.
- The map helps to find these areas.
- It is necessary to cross-reference the map with other information.
- For example: where elderly or vulnerable people live.
- Then, we plant trees and add water to cool down.
7️⃣ CROSS-ANALYSIS — VALUES OF HEALTH PRACTICES
- Literacy: the booklet simplifies greatly (diagrams, pictograms, use cases in the form of Q&A), making a technical concept accessible to non-specialists (p.16-35).
- Empowerment: it directly equips elected officials and technicians to carry out a pre-diagnosis themselves without heavy expertise, but does not involve residents in the production of the diagnosis (p.16).
- Participation: co-construction with residents is mentioned mainly as downstream awareness (workshops, public communication in Rodez and at CINOR), not as upstream co-design (p.9, p.28-31).
- Community health : the collective dimension is integrated through the intersection with vulnerable populations and sensitive establishments, but the approach remains focused on planning rather than community mobilization (p.28-29, p.38).
- Ethics : the document acknowledges its limitations (the tool does not measure ICU) and invites not to overinterpret the map, a stance of methodological honesty (p.22-23).
- Human rights : equity appears through attention to vulnerable populations and energy poverty (“thermal kettles”), without an explicit framework of environmental justice (p.38, p.41).
- Intersectorality : the tool is designed to intersect urban planning, health, biodiversity, water, and mobility, and cites numerous partners (BRGM, Météo France, urban planning agencies, associations) (p.30-42).
- Partnership : collaboration models are formalised through use cases (MEL/Cerema, Rodez/PRSE, Grand Reims/Météo France) and the support offer from Cerema (p.24-35, p.46).
- Fight against discrimination : the document does not address discrimination as such; it targets inequalities in exposure to heat (age, precariousness) without addressing non-judgment or cultural diversity.
8️⃣ EVALUATION OF RESOURCE RELIABILITY
Scientific relevance — high. The tool is based on a validated international framework (Stewart and Oke, 2012), a proven Cerema method since 2017 and documented (SPOT imagery 2022, open QGIS chain on GitHub). The cited health data is attributed to identified sources (SPF, Météo France). The document transparently outlines its own limitations, which enhances its credibility.
Operational relevance — very high. It is its strength: free access without registration, ready-to-use municipal statistics, five transferable use cases, clear articulation with urban planning documents and support offered by Cerema. Directly mobilisable from the first reading.
Internal points of caution to note:
- The territorial coverage is evolving (updates indicated on the platform, regular addition of urban areas): check that your municipality is well covered before concluding (p.20-21).
- The sensitivity thresholds (LCZ 1 to 5, 8, E) are given as national benchmarks; the document itself specifies that the same class does not produce the same level of overheating depending on the climate and immediate environment (p.22-23). Not to be applied mechanically.
- A minor editorial error appears on page 11 ("foundation of LZC" for LCZ), without impact on the content.
- The figure "summer 2023: over 5,000 deaths" (p.4) pertains to the attribution of the document; the most recent SPF reports (2024, 2025) provide different orders of magnitude depending on the summers — to be contextualised if reused.
9️⃣ STRATEGIC HASHTAGS
#healthpractices #ClimateAdaptation #HeatIsland #EnvironmentalHealth #Cooling #Renaturation #ClimateEquity #UrbanPlanning
This article has been developed in accordance with the Charter
of the use of artificial intelligence in Health Practices.
Click on the image